Overview: Inference for proportions
Lecture 19
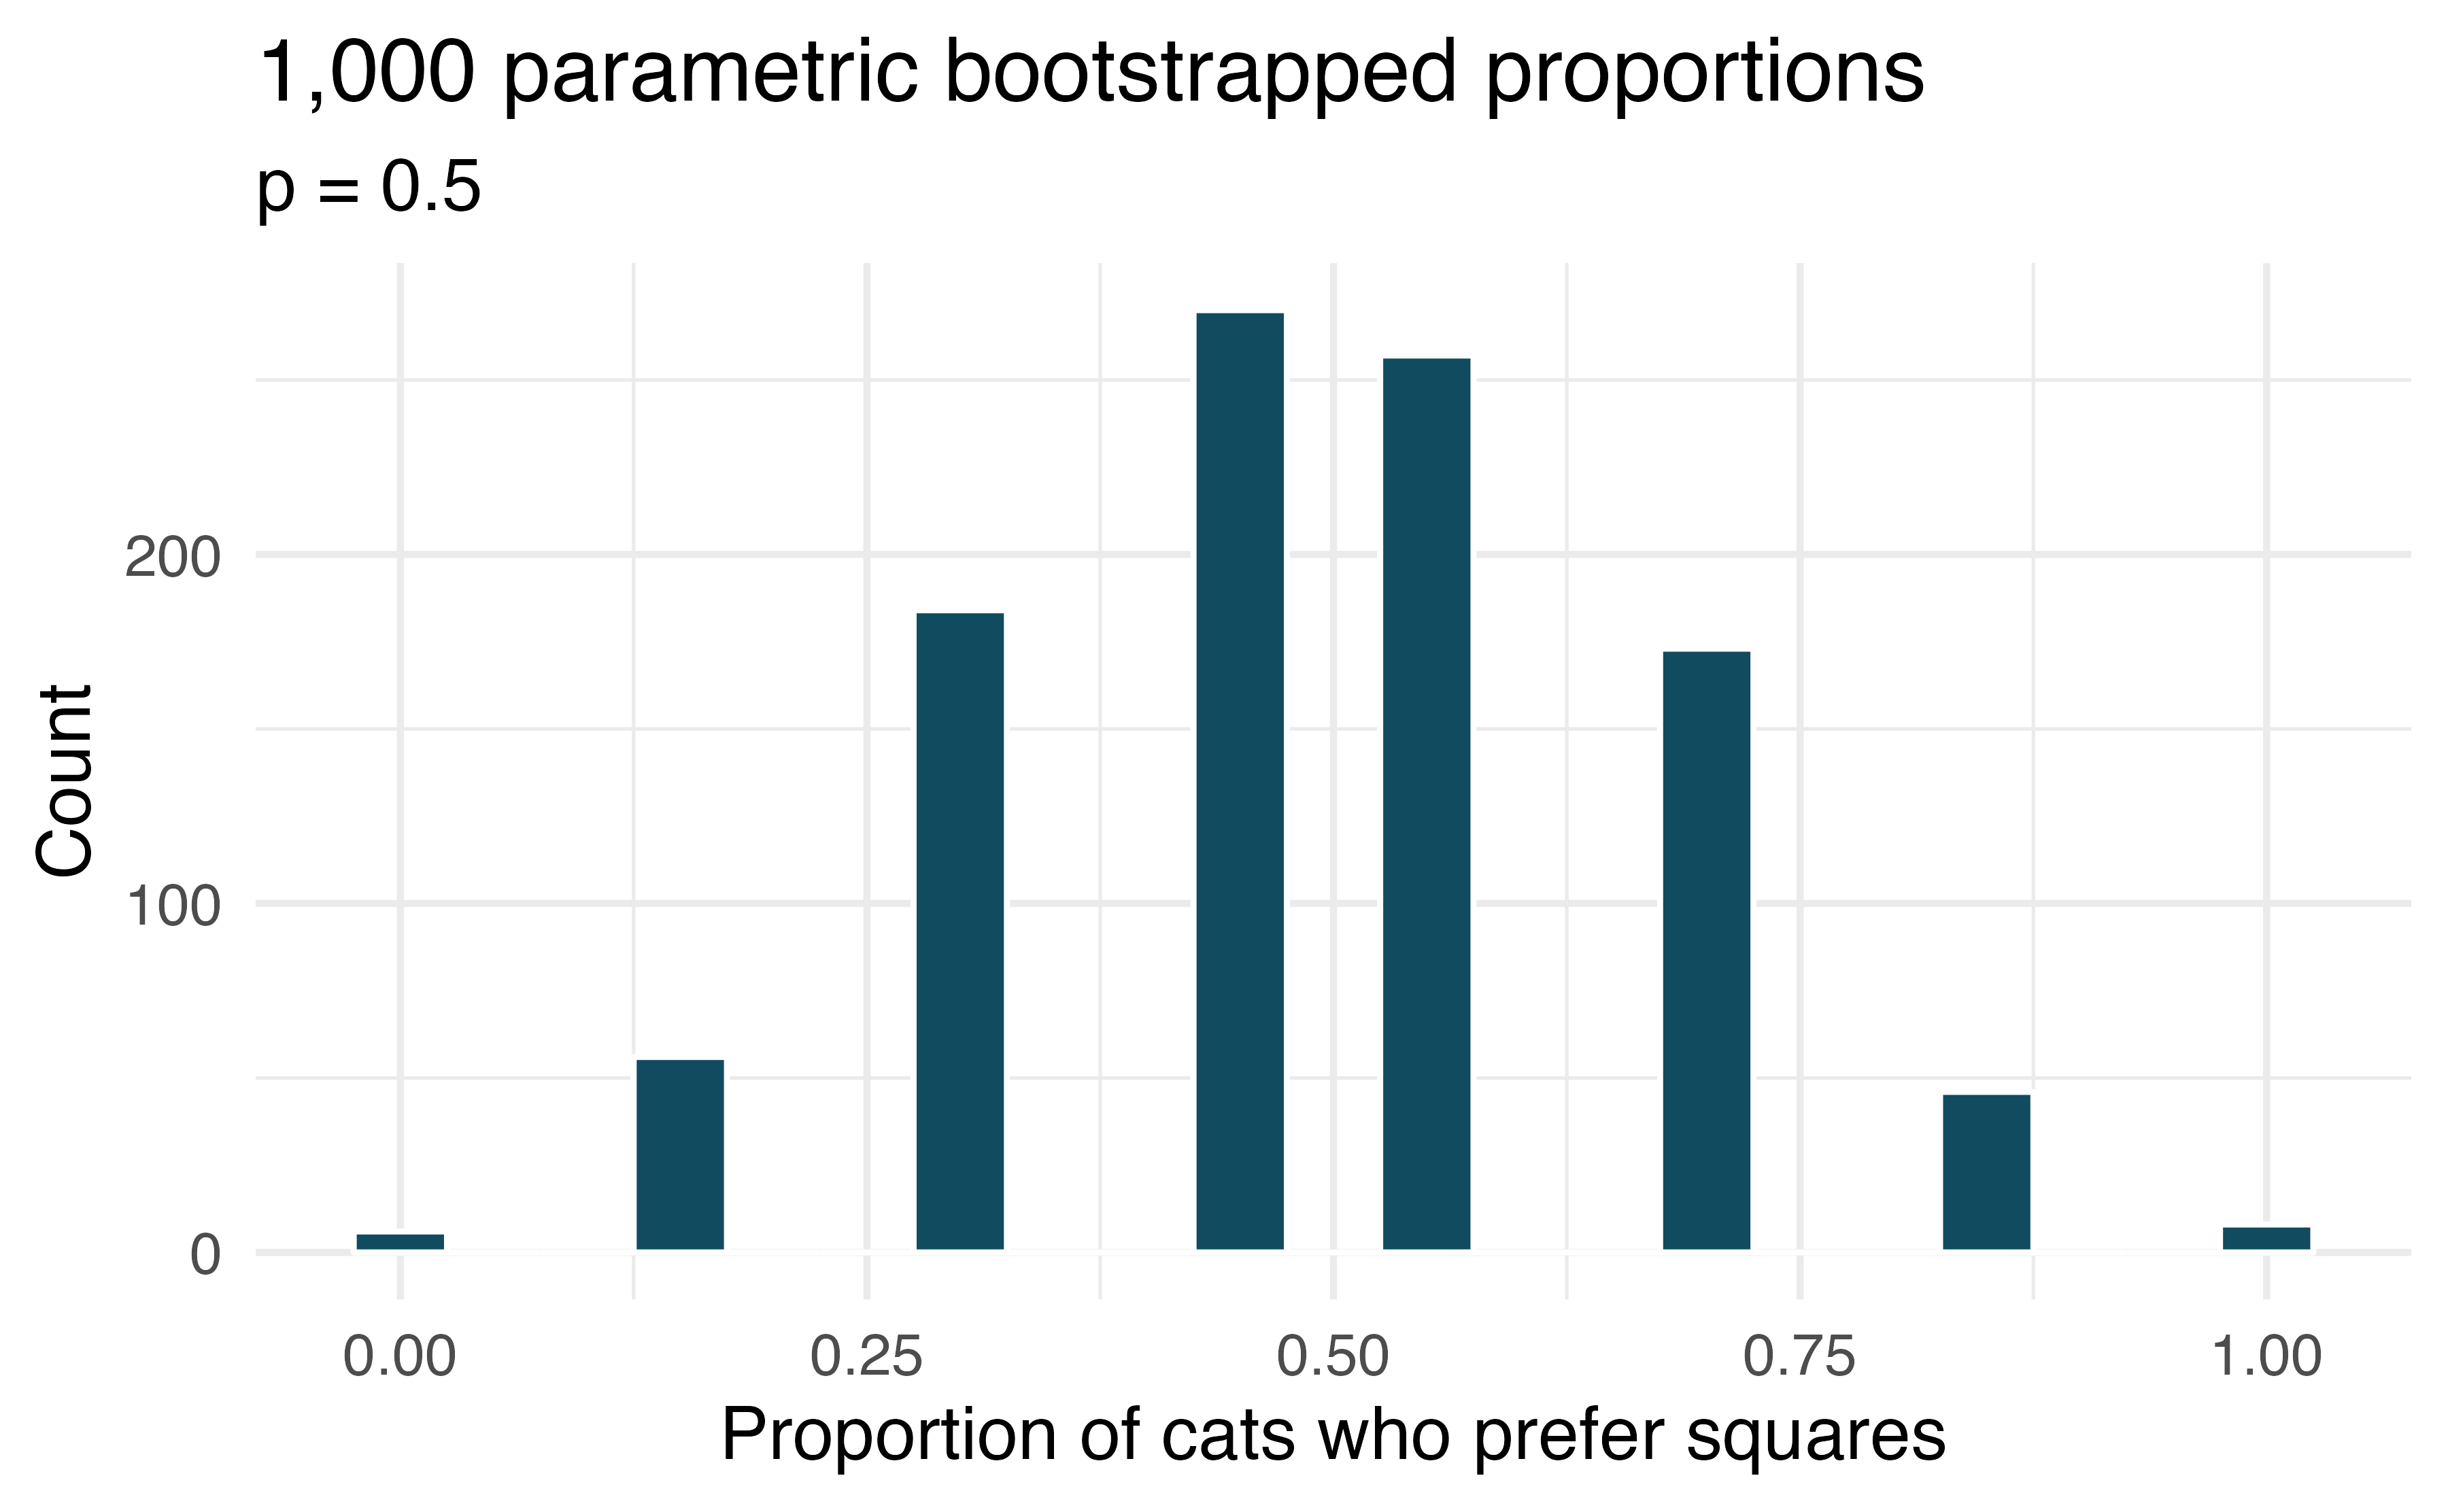
If I fits, I sits
A parametric bootstrap simulation (with 1,000 bootstrap samples) was run and the resulting null distribution is displayed in the histogram below. Find the p-value using this distribution and conclude the hypothesis test in the context of the problem.
Legalization of marijuana
A parametric bootstrap simulation (with 1,000 bootstrap samples) was run and the resulting null distribution is displayed in the histogram below. Find the p-value using this distribution and conclude the hypothesis test in the context of the problem.
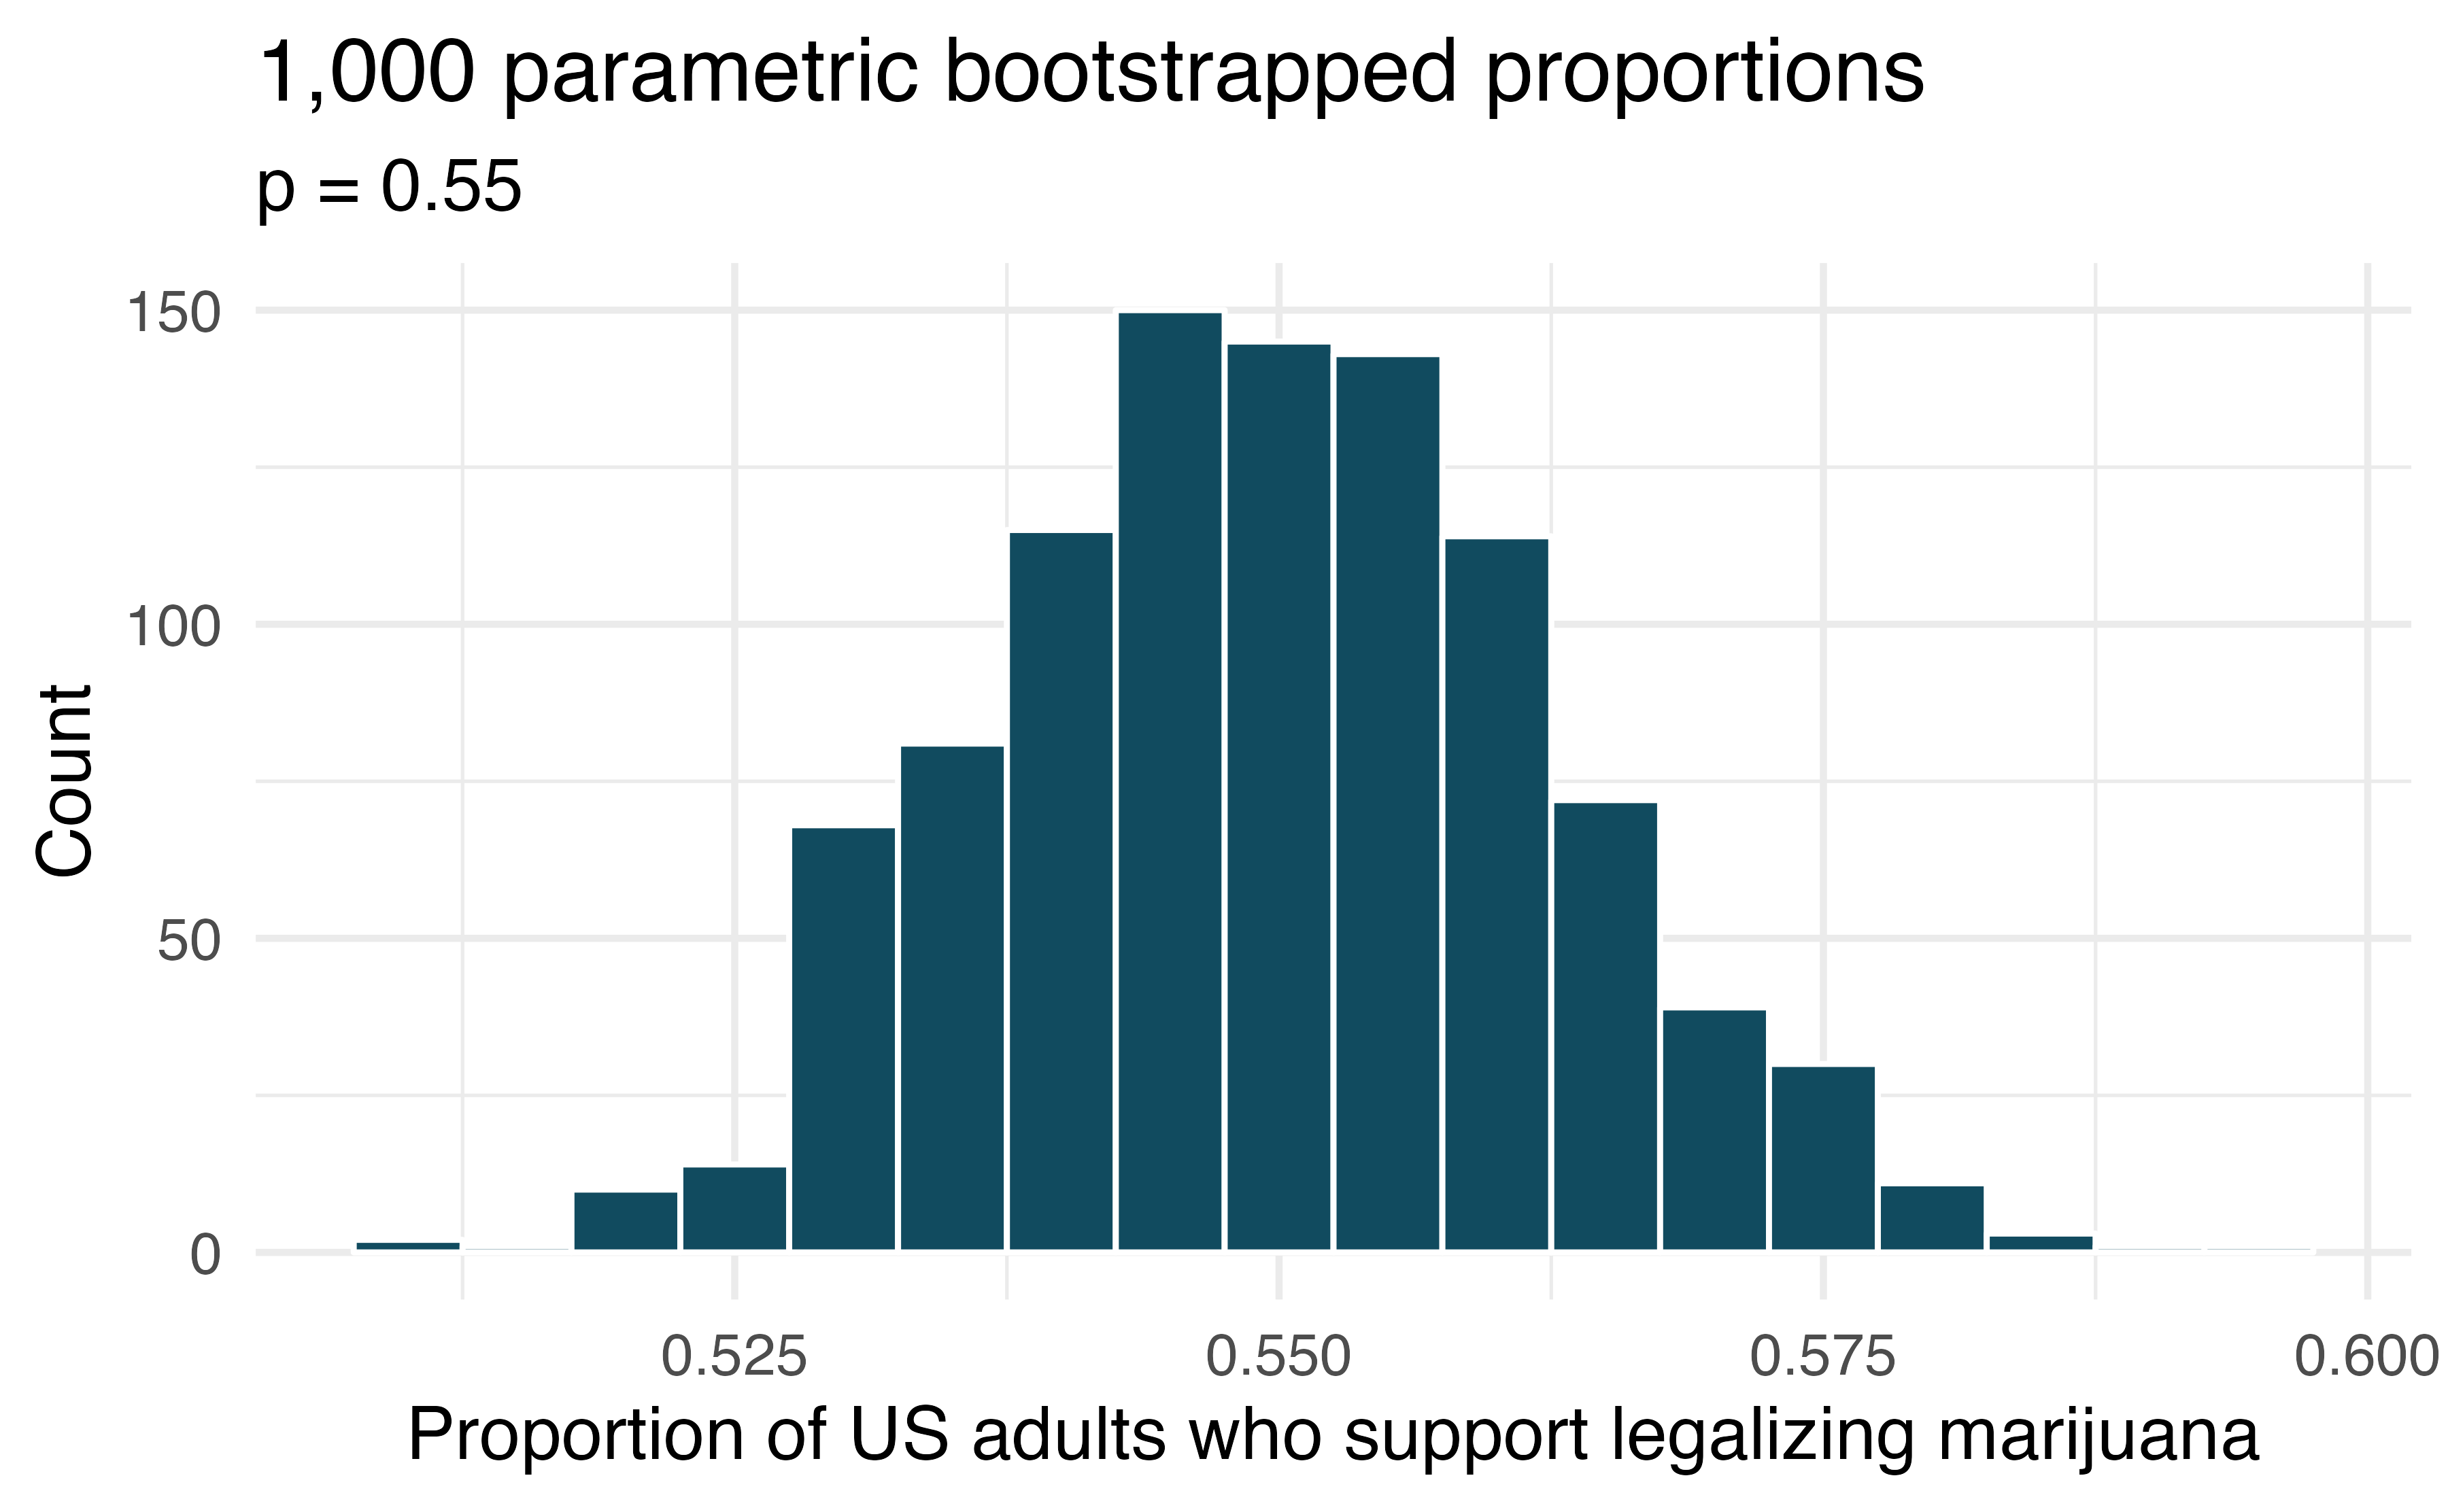
Legalization of marijuana - SE estimate
A parametric bootstrap simulation (with 1,000 bootstrap samples) was run and the resulting null distribution is displayed in the histogram below. This distribution shows the variability of the sample proportion in samples of size 1,563 when 55% of voters approve legalizing marijuana. What is the approximate standard error of the sample proportion based on this distribution?
Legalization of marijuana - mathematical interval
The General Social Survey asked a random sample of 1,563 US adults: “Do you think the use of marijuana should be made legal, or not?” 60% of the respondents said it should be made legal.
Is 60% a sample statistic or a population parameter? Explain.
Using a mathematical model, construct a 95% confidence interval for the proportion of US adults who think marijuana should be made legal, and interpret it.
A critic points out that this 95% confidence interval is only accurate if the statistic follows a normal distribution, or if the normal model is a good approximation. Is this true for these data? Explain.
A news piece on this survey’s findings states, “Majority of US adults think marijuana should be legalized.” Based on your confidence interval, is this statement justified?
![]()