Inference one mean

Lecture 20

Dr. Mine Çetinkaya-Rundel

Duke University
STA 101 - Fall 2023

Warm up

Announcements

  • Slight change of plans on materials post-Thanksgiving
  • Exam 2 to be returned Monday after Thanksgiving

Inference for one mean

Today’s focus

  • Inference for a population mean

  • Specifically, estimating a population mean via a confidence interval

  • And generally, what in the world is a confidence interval?!

    • Why is it constructed?

    • How is it constructed?

    • What do the bounds of a confidence interval mean?

    • What does the confidence level mean?

    • What is the margin of error?

Setup

library(tidyverse)
library(openintro)
library(tidymodels)

Bootstrap confidence interval for the mean

  1. Take a bootstrap sample (sample with replacement) of size n (the original sample size) from the original sample

  2. Record the mean

  3. Repeat steps 1 and 2 many times to build the bootstrap distribution

  4. Find the bootstrap confidence interval using one of two methods:

    • Percentile method: The bounds of the middle X% of the bootstrap distribution comprise the X% bootstrap interval.

    • Standard error method:

      • Calculate the standard error for the bootstrap distribution

      • Find the critical value associated with the X% confidence interval

      • Calculate the margin of error (ME) as the critical value \(\times\) standard error

      • Construct the confidence interval a the original sample mean \(\pm\) ME

Case study: Length of gestation

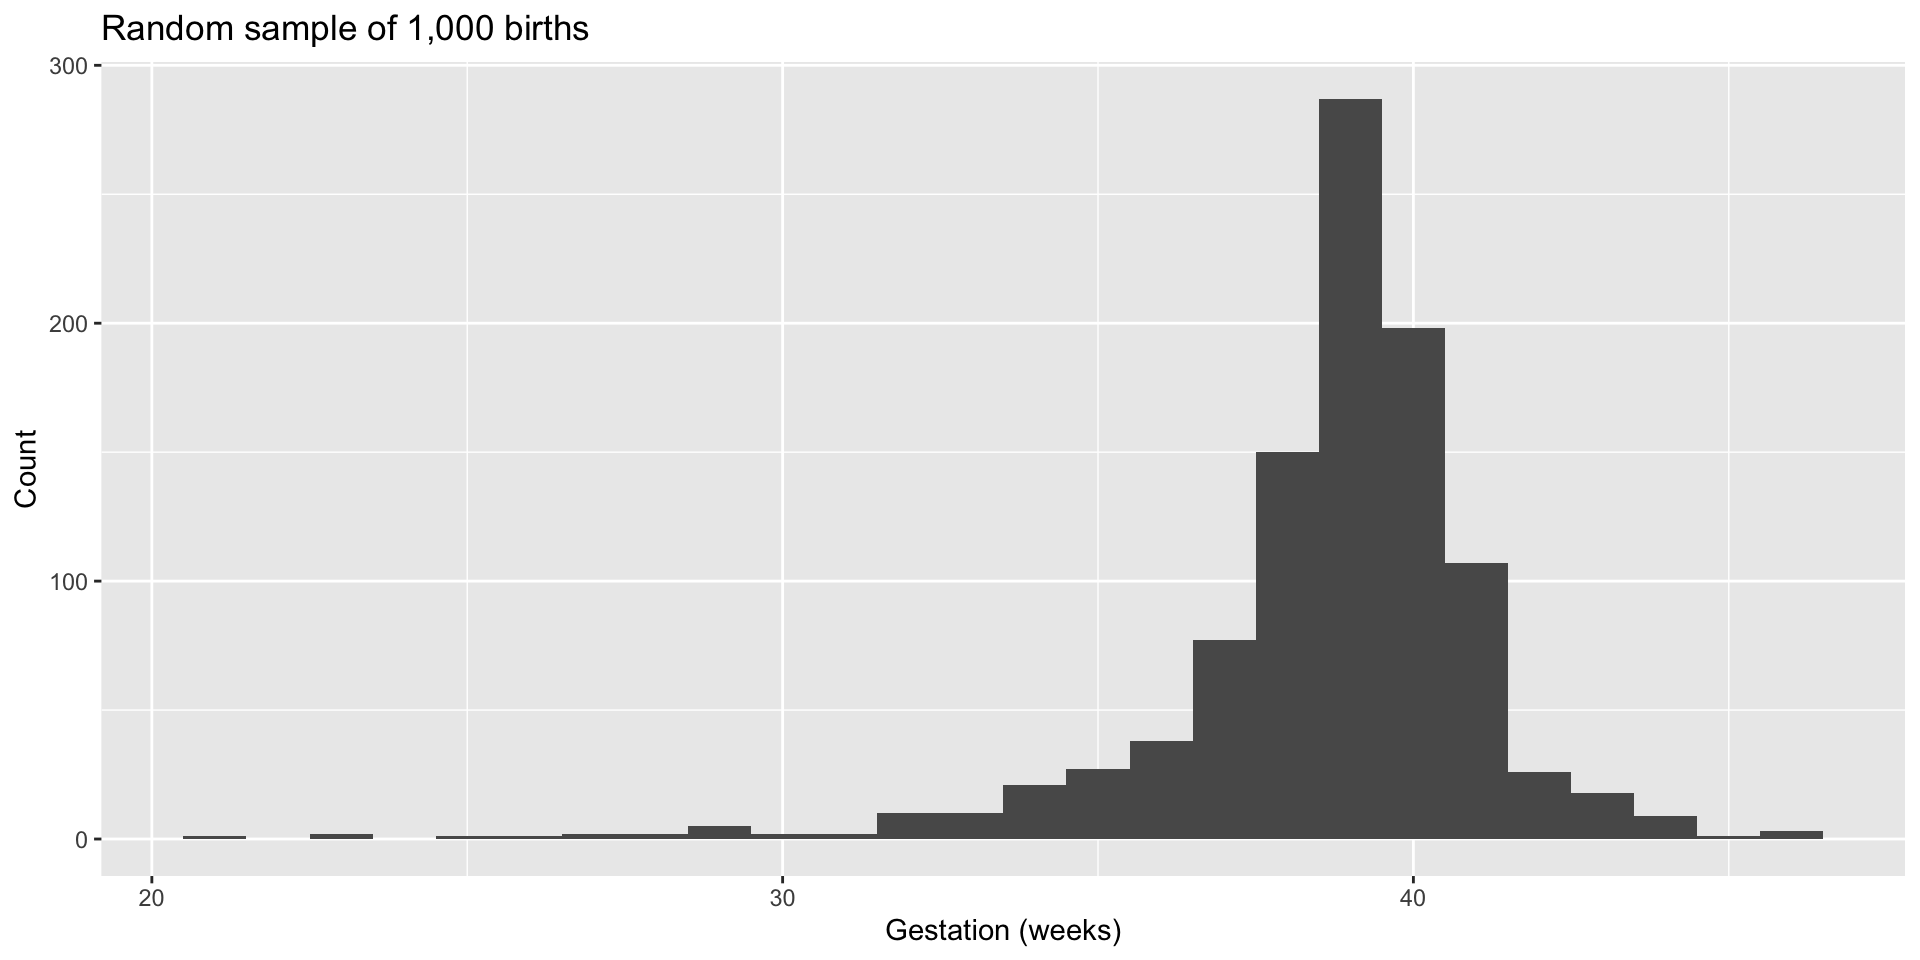
Every year, the United States Department of Health and Human Services releases to the public a large dataset containing information on births recorded in the country. This dataset has been of interest to medical researchers who are studying the relation between habits and practices of expectant mothers and the birth of their children. In this case study we work with a random sample of 1,000 cases from the dataset released in 2014. The length of pregnancy, measured in weeks, is commonly referred to as gestation. The histogram below shows the distribution of lengths of gestation from the random sample of 1,000 births.

ggplot(
  openintro::births14, 
  aes(x = weeks)
  ) +
  geom_histogram(binwidth = 1) +
  labs(
    x = "Gestation (weeks)",
    y = "Count",
    title = "Random sample of 1,000 births"
  )

CS: Length of gestation - boot_dist

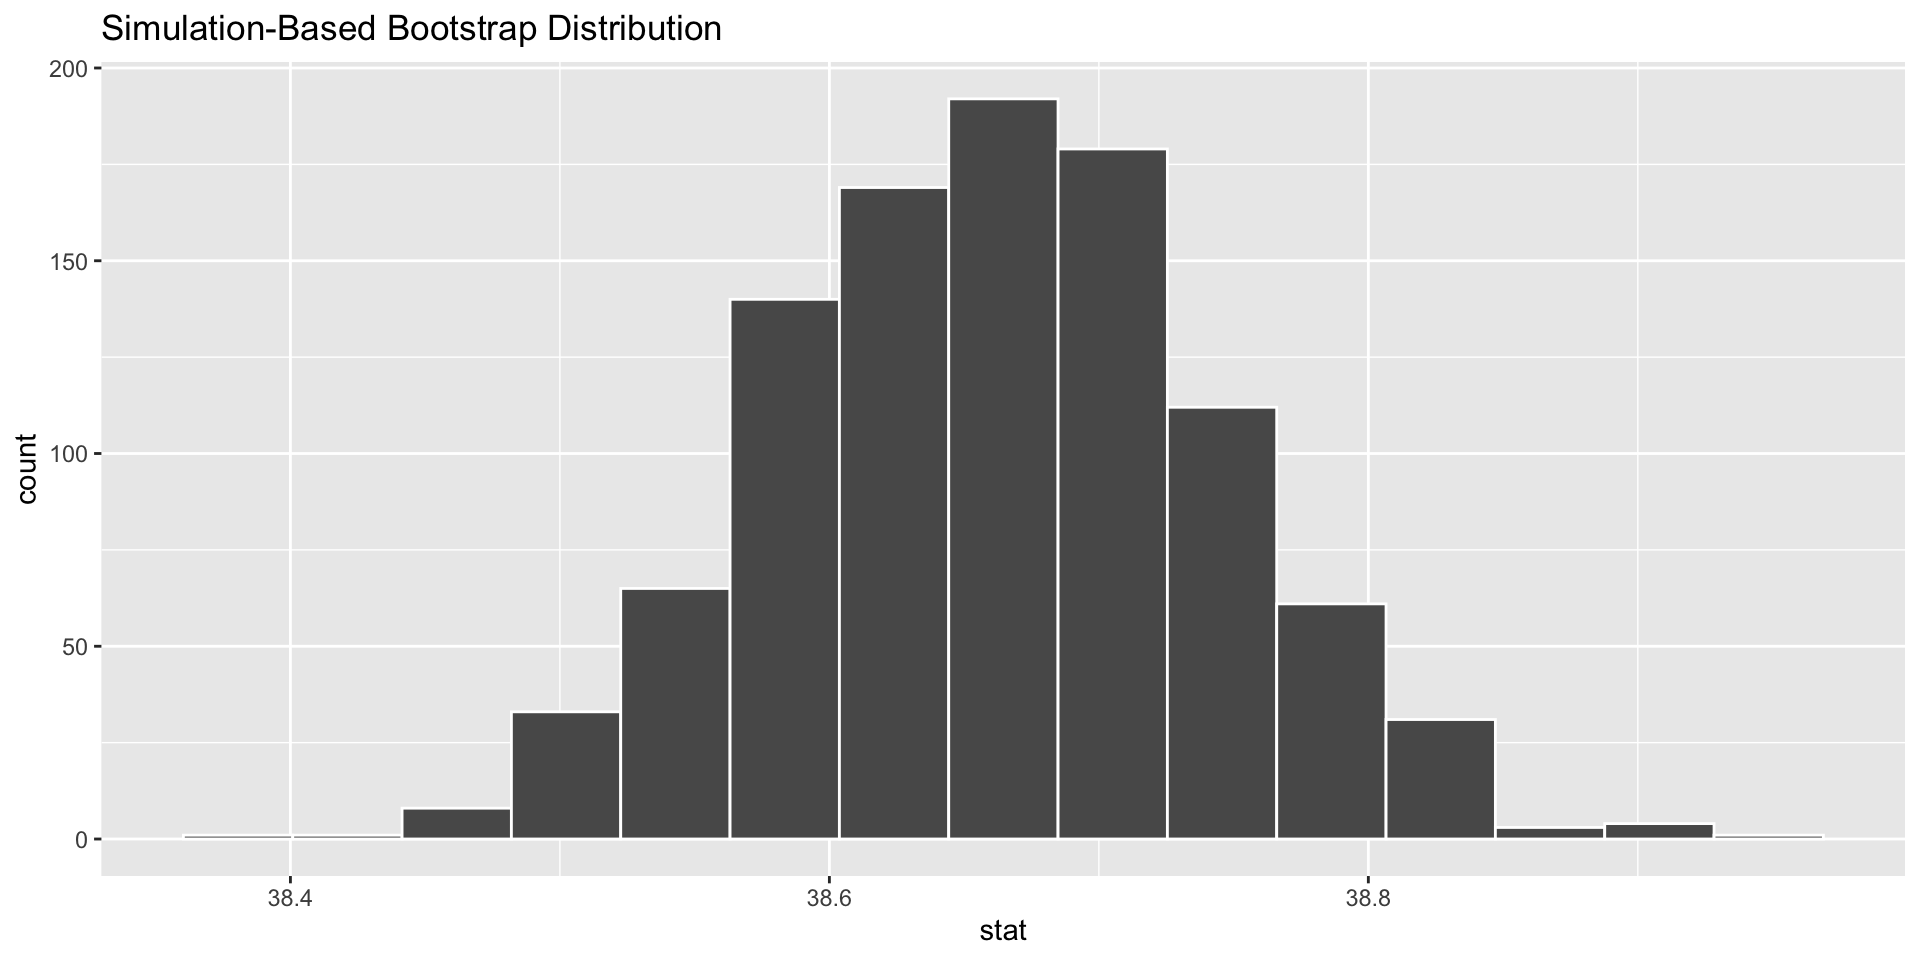
The distribution of bootstrapped means of gestation from 1,500 different bootstrap samples.

set.seed(1234)

boot_dist <- births14 |>
  specify(response = weeks) |>
  generate(
    reps = 1000, 
    type = "bootstrap"
  ) |>
  calculate(stat = "mean")

visualize(boot_dist)

CS: Length of gestation - percentile interval

What does the following code do? How do you adjust it to change the confidence level?

boot_dist |>
  get_ci()
# A tibble: 1 × 2
  lower_ci upper_ci
     <dbl>    <dbl>
1     38.5     38.8

CS: Length of gestation - standard error interval

What does the following code do? Why do we need to provide point_estimate?

obs_stat <- births14 |>
  specify(response = weeks) |>
  calculate(stat = "mean")

obs_stat
Response: weeks (numeric)
# A tibble: 1 × 1
   stat
  <dbl>
1  38.7
boot_dist |>
  get_ci(
    type = "se",
    point_estimate = obs_stat
  )
# A tibble: 1 × 2
  lower_ci upper_ci
     <dbl>    <dbl>
1     38.5     38.8

Interpretations

  • The interval:

    We are X% confident that the true population mean is within our confidence interval.

  • The confidence level:

    What does 95% confidence interval mean?

Application exercise

Go to Posit Cloud and continue the project titled ae-15-Gestation.