Inference two means

Lecture 21

Dr. Mine Çetinkaya-Rundel

Duke University
STA 101 - Fall 2023

Warm up

Announcements

  • Project 2:
    • Assignment details + teams posted: https://sta101-f23.github.io/project/project-2.html
    • All team members must be in lab on Friday for the proposal conversation with your TA (5 pts / 100 total points for the project)
    • Before Friday: Meet with your team at least once to decide on a dataset and research question
    • Wednesday in class: Last 20-30 minutes dedicated to project work
  • Lab 8:
    • To be posted by Friday
    • Optional submission: If you submit, it will be considered as part of your grade. If you don’t, your HW grade will be calculated out of 7 labs. Either way, lowest score will be dropped.

Inference for comparing two means

Today’s focus

  • Inference for comparing two population means

  • Specifically, making decisions via hypothesis tests

  • And generally, what in the world is a hypothesis test?!

    • Why is it conducted?

    • How is it conducted?

    • What does the p-value mean?

    • What does it mean to reject or fail to reject a null hypothesis?

    • What are testing errors?

    • What is the power of the test?

Setup

library(tidyverse)
library(openintro)
library(tidymodels)
library(ggthemes)

Randomization test for comparing two means

  1. Combine the data from the two groups and randomly shuffle them into two groups of sizes equal to the original group sample sizes

  2. Calculate the means of each group and record the different

  3. Repeat steps 1 and 2 many times to build the null distribution

  4. Find the p-value as the number of simulations with simulated differences at least as extreme (in the direction of the alternative hypothesis) as the observed difference

Case study: Birth weights of babies and smoking

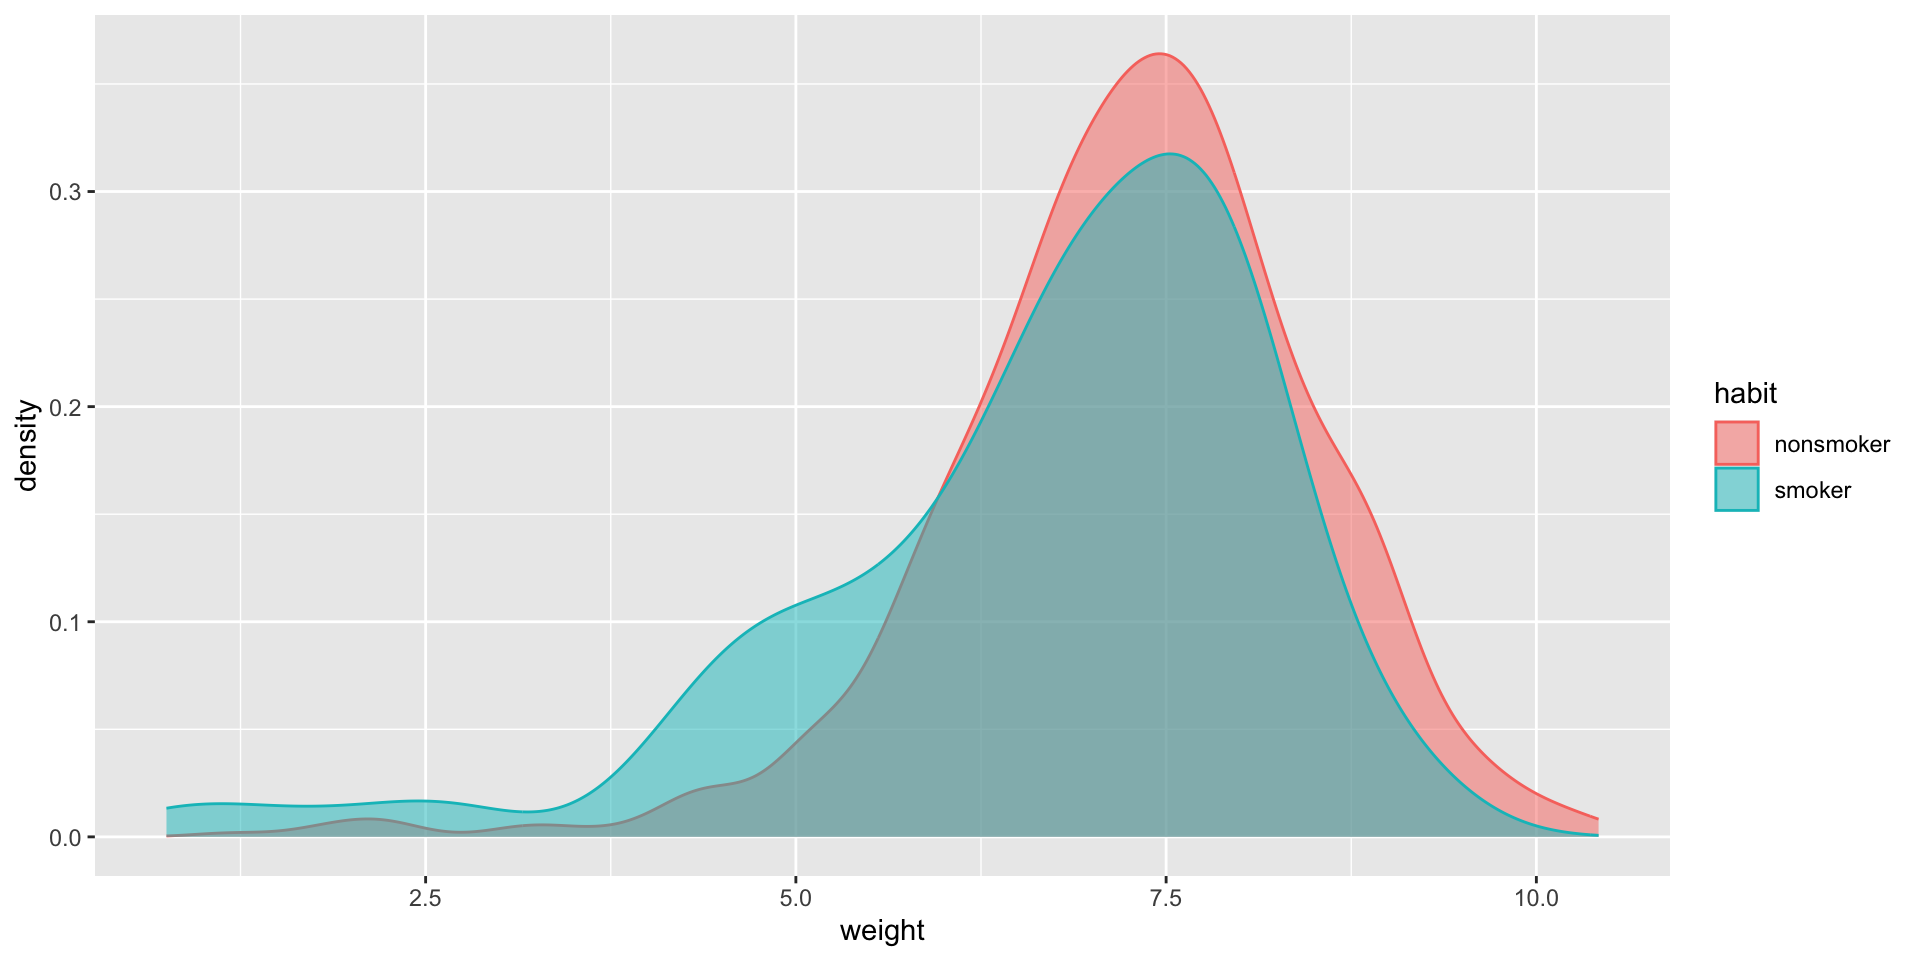
Every year, the United States Department of Health and Human Services releases to the public a large dataset containing information on births recorded in the country. This dataset has been of interest to medical researchers who are studying the relation between habits and practices of expectant mothers and the birth of their children. In this case study we work with a random sample of 1,000 cases from the dataset released in 2014. The distributions of birth weights of babies, measured in pounds, by mother’s smoking habit are shown below.

openintro::births14 |>
  drop_na(habit) |>
  ggplot(aes(x = weight, color = habit, fill = habit)) +
  geom_density(alpha = 0.5)

Application exercise

Go to Posit Cloud and continue the project titled ae-16-Birth weights.