In this application exercise, we’ll do inference on a single population proportion.
Packages
We’ll use the tidyverse and tidymodels packages.
Data
In a survey conducted by Survey USA between September 30, 2023 and October 3, 2023, 2759 registered voters from all 50 US states were asked
America will hold an election for President of the United States next November. Not everyone makes the time to vote in every election. Which best describes you? Are you certain to vote? Will you probably vote? Are the chances you will vote about 50/50? Or will you probably not vote?
The data from this survey can be found in your data folder: voting-survey.csv.
Exercise 1
What, if anything, do you know about voter turnout in the US?
~60% last presidential election.
Exercise 2
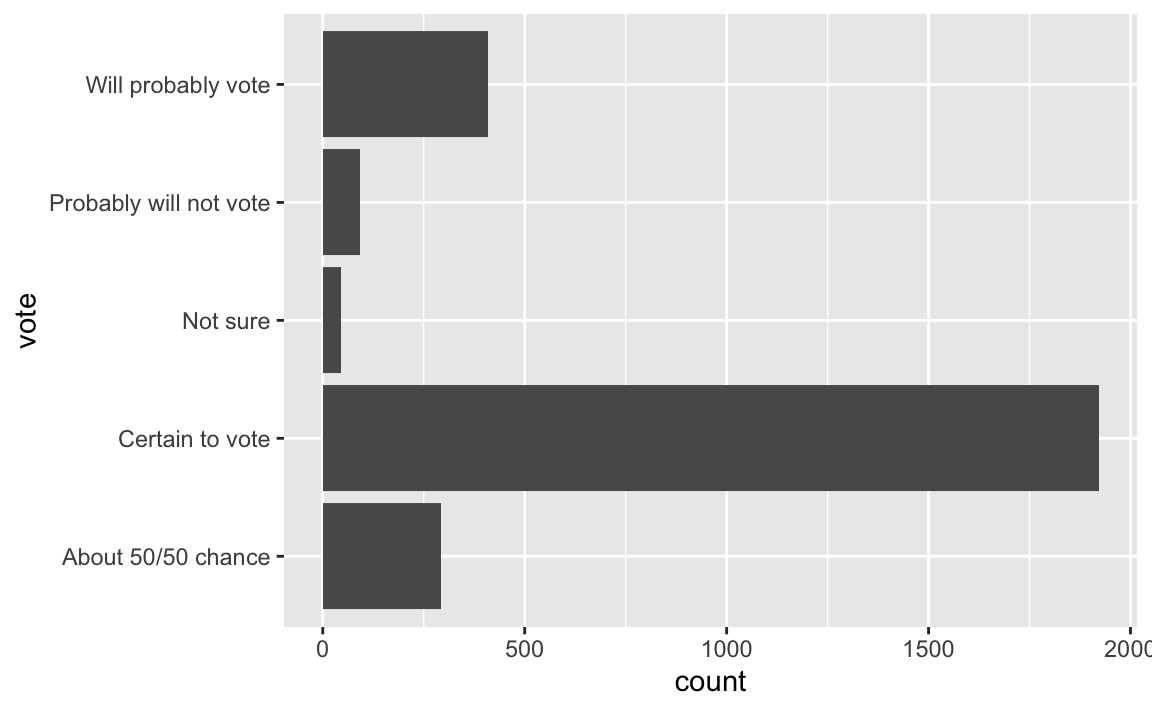
Load the data and visualize the distribution of responses. Also calculate the proportion of respondents who are certain to vote in the next presidential election.
Rows: 2759 Columns: 2
── Column specification ────────────────────────────────────────────────────────
Delimiter: ","
chr (1): vote
dbl (1): id

ℹ Use `spec()` to retrieve the full column specification for this data.
ℹ Specify the column types or set `show_col_types = FALSE` to quiet this message.
# A tibble: 1 × 3
  vote                n p_hat
  <chr>           <int> <dbl>
1 Certain to vote  1921 0.696
Estimation
Based on these data, we want to estimate the true proportion of registered US voters who are certain to vote in the next presidential election.
Exercise 3
What is the parameter of interest?
Proportion of all registered voters who are certain to vote in the next presidential election
Exercise 4
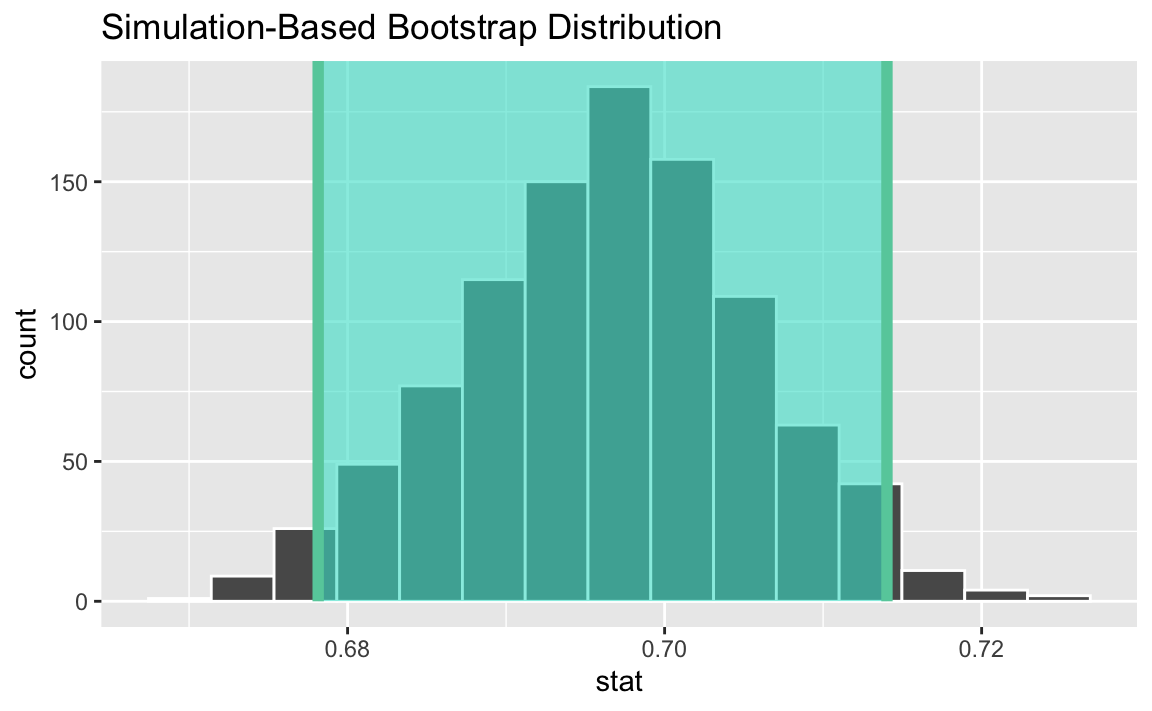
Estimate using a 95% bootstrap interval.
Exercise 5
Suppose the bounds of this interval are L = 0.681 and U = 0.713, your friend interprets the interval as
95% of the time, the true proportion of registered US voters who are certain to vote in the next presidential election is between L and U.
Comment on this interpretation. Is it correct? If not, how would ix it?
Not correct. We are 95% confident that 68.1% to 71.3% of all registered voters are certain to vote in the next presidential election.
Testing
A newspaper claims that more than 60% of registered US voters are certain to vote in the next presidential election and cites this study as evidence. Do these data provide convincing evidence for this claim?
Exercise 6
What are the hypotheses?
H0: There is nothing going on, 60% of registered US voters are certain to vote in the next presidential election. p = 0.6.
HA: There is something going on, more than 60% of registered US voters are certain to vote in the next presidential election. p > 0.6.
Exercise 7
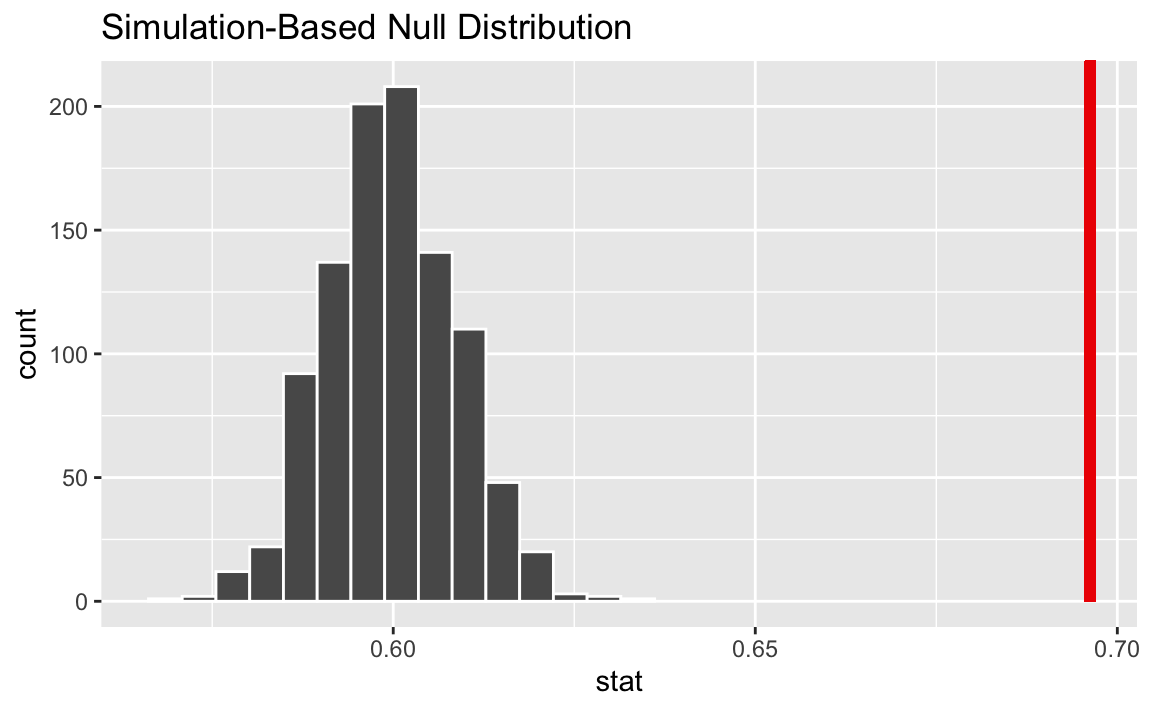
Conduct a randomization test, at 5% discernability level, for this claim. What is the conclusion of the test?
The p-value is approximately 0, which is lower than the 5% discernability level, so we would reject the null hypothesis. The data provide convincing evidence for the alternative hypothesis.
Warning: Please be cautious in reporting a p-value of 0. This result is an
approximation based on the number of `reps` chosen in the `generate()` step.
See `?get_p_value()` for more information.
# A tibble: 1 × 1
  p_value
    <dbl>
1       0
Warning in min(diff(unique_loc)): no non-missing arguments to min; returning
Inf
Exercise 8
Suppose the p-value you found is P, and your friends are in disagreement about the interpretation about this value. One friend claims:
The probability that 60% of all of registered US voters are certain to vote in the next presidential election is approx 0.
Another friend claims:
The probability that more than 60% of all of registered US voters are certain to vote in the next presidential election is approx 0.
Who is right? Explain your reasoning.
Both friends are wrong. The p-value is neither the probability of H0 being true, not the probability of HA being true.
Conceptual
Exercise 9
What is \(p\) vs. \(\hat{p}\) vs. p-value. Explain generically as well as in the context of these data and research question.
Add response here.
Exercise 10
What is sampling distribution vs. bootstrap distribution vs. null distribution? Explain generically as well as in the context of these data and research question.
Add response here..