library(tidyverse)
library(tidymodels)
library(ggthemes)Issues candidates should talk more about
In this application exercise, we’ll do inference tables – categorical variables with many levels.
Packages
We’ll use the tidyverse and tidymodels packages.
Data
A September 16-19, 2023, asked North Carolina voters, among other issues, about issues of equality and women’s progress. Specifically, one of the questions asked:
If you had to choose just one issue that you would like candidates to talk more about in the 2024 campaigns, what would that issue be?
Economy
Abortion/Reproductive rights
Immigration
Crime
Gun rights/restrictions
Something else
Don’t know
The survey also asked respondents’ party affiliation:
What political party do you most identify with?
Democrat
Republican
Unaffiliated
Other
The results of this survey are summarized in this report and the data can be found in your data folder: candidate-talk.csv.
Hypotheses
Exercise 1
State the hypotheses for evaluating whether the issue of choice is independent of party affiliation.
H0: Issue of choice and party affiliation are independent.
HA: Issue of choice and party affiliation are independent.
Data
Exercise 2
Load the data.
candidate_talk <- read_csv("data/candidate-talk.csv")Exercise 3
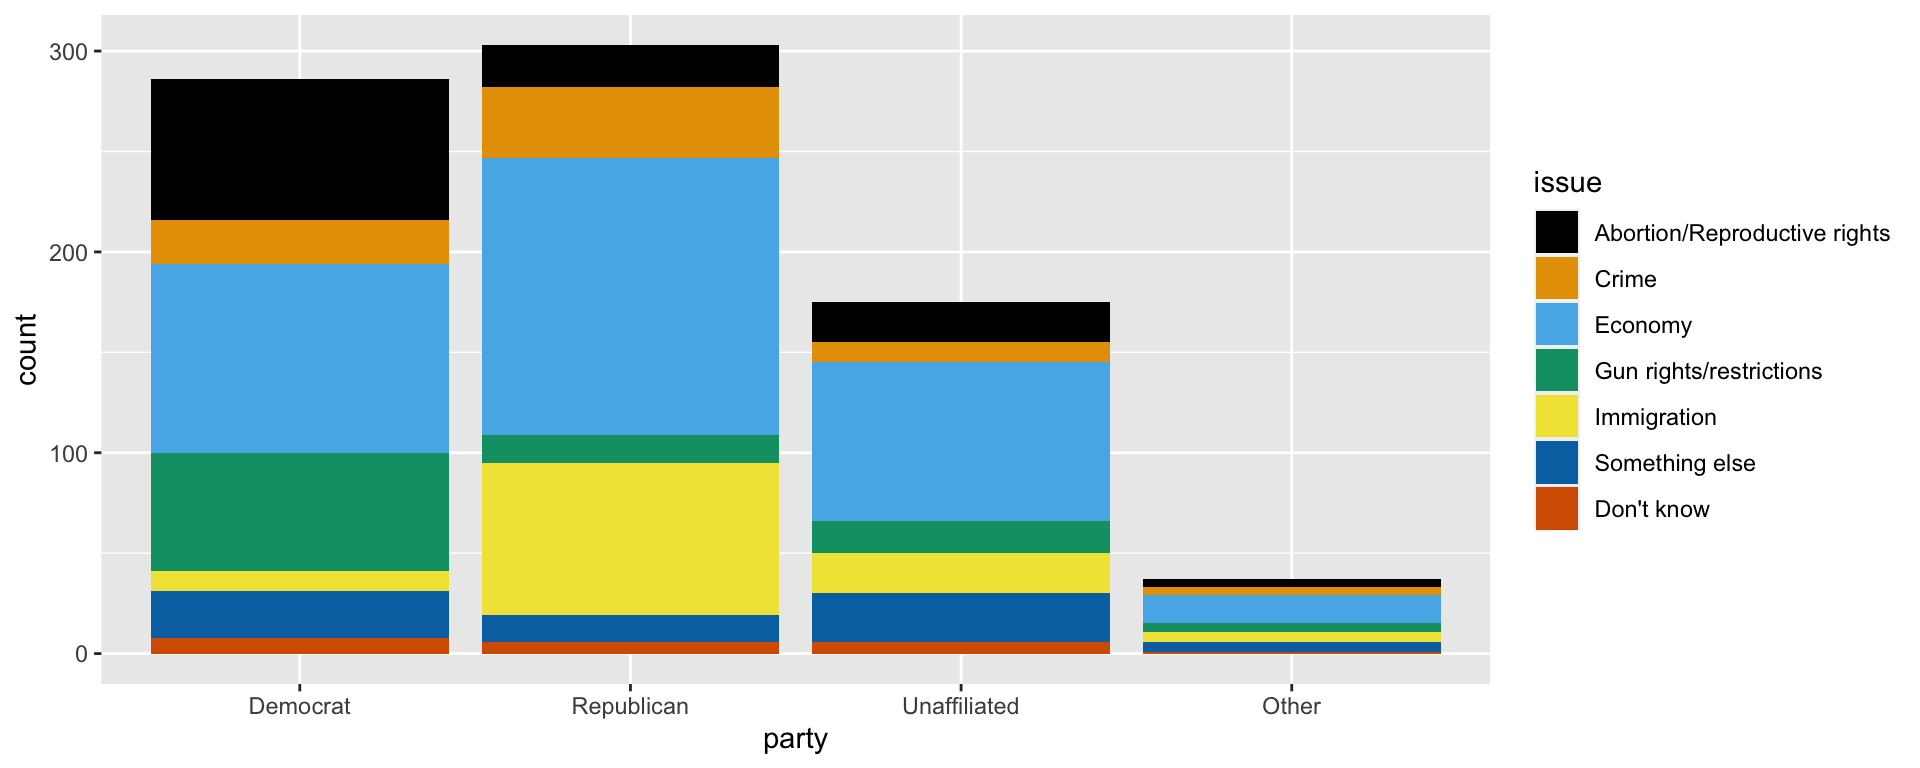
Create a two-way table of the responses across the two age groups and visualize the frequency distribution.
candidate_talk <- candidate_talk |>
  mutate(
    party = fct_relevel(party, "Democrat", "Republican", "Unaffiliated", "Other"),
    issue = fct_relevel(issue, "Abortion/Reproductive rights", "Crime", "Economy", "Gun rights/restrictions", "Immigration", "Something else", "Don't know")
  )

candidate_talk_table <- candidate_talk |>
  count(party, issue) |>
  pivot_wider(names_from = "issue", values_from = "n")

candidate_talk_table
# A tibble: 4 × 8
party Abortion/Reproductiv…¹ Crime Economy Gun rights/restricti…² Immigration
<fct> <int> <int> <int> <int> <int>
1 Democ… 70 22 94 59 10
2 Repub… 21 35 138 14 76
3 Unaff… 20 10 79 16 20
4 Other 4 4 14 4 5
# ℹ abbreviated names: ¹`Abortion/Reproductive rights`,
# ²`Gun rights/restrictions`
# ℹ 2 more variables: `Something else` <int>, `Don't know` <int>ggplot(candidate_talk, aes(x = party, fill = issue)) +
geom_bar() +
scale_fill_colorblind()
Exercise 4
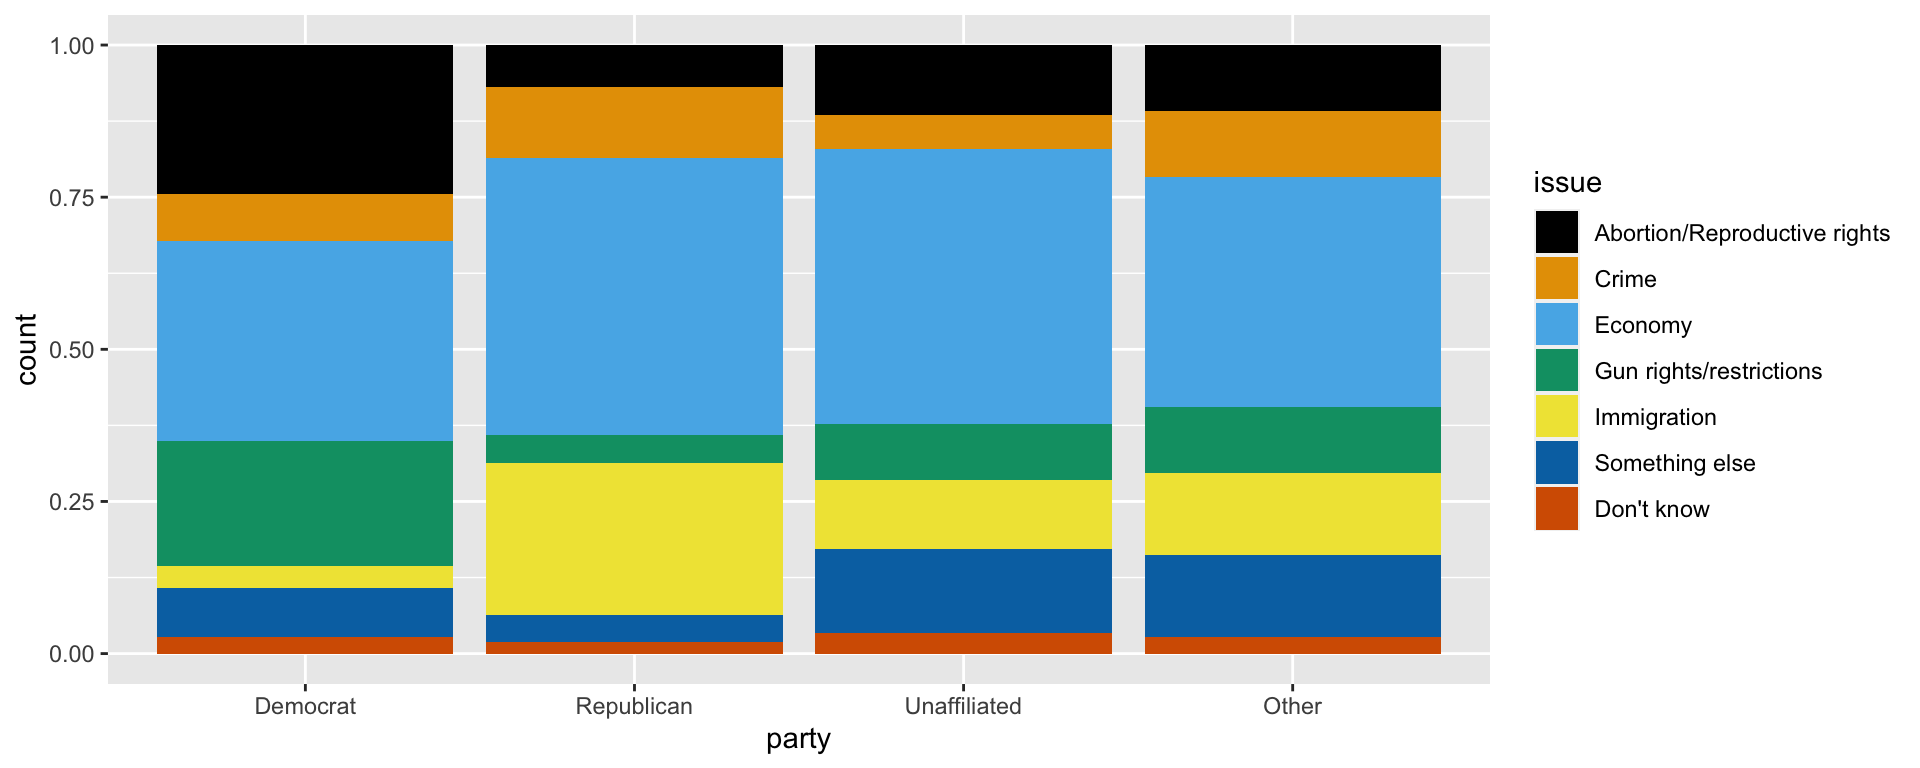
Which do you think should be the explanatory variable and which the response variable? Accordingly, create a visualization that shows the correct conditional probabilities.
ggplot(candidate_talk, aes(x = party, fill = issue)) +
  geom_bar(position = "fill") +
  scale_fill_colorblind()
Testing
Exercise 5
Calculate the observed sample statistic.
obs_stat <- candidate_talk |>
  specify(response = issue, explanatory = party) |>
  hypothesize(null = "independence") |>
  calculate(stat = "Chisq")

obs_stat
Response: issue (factor)
Explanatory: party (factor)
Null Hypothesis: independence
# A tibble: 1 × 1
stat
<dbl>
1 144.Exercise 6
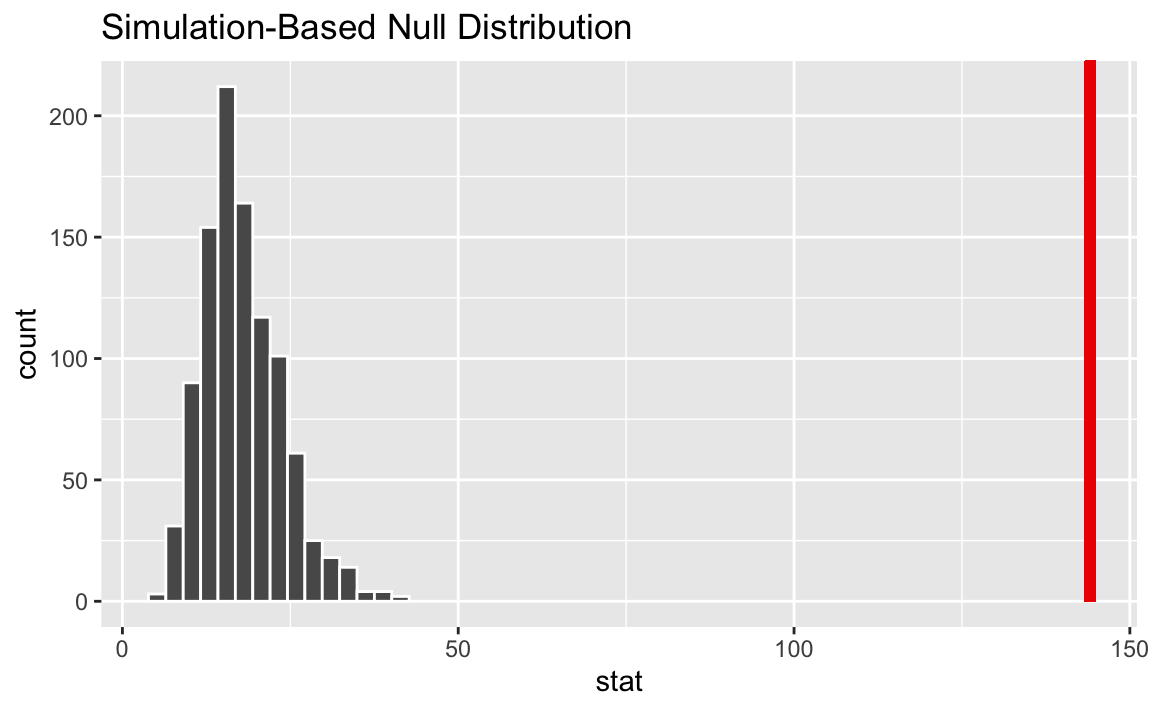
Conduct the hypothesis test using randomization and visualize and report the p-value.
set.seed(1234)

null_dist <- candidate_talk |>
  specify(response = issue, explanatory = party) |>
  hypothesize(null = "independence") |>
  generate(reps = 1000, type = "permute") |>
  calculate(stat = "Chisq")

null_dist |>
  get_p_value(obs_stat = obs_stat, direction = "greater")
Warning: Please be cautious in reporting a p-value of 0. This result is an
approximation based on the number of `reps` chosen in the `generate()` step.
See `?get_p_value()` for more information.# A tibble: 1 × 1
p_value
<dbl>
1 0null_dist |>
visualize() +
shade_p_value(obs_stat = obs_stat, direction = "greater")Warning in min(diff(unique_loc)): no non-missing arguments to min; returning
Inf
Exercise 7
What is the conclusion of the hypothesis test?
With a p-value of approximately 0, which is smaller than the discernability level of 0.05, we reject the null hypothesis. The data provide convincing evidence that there is a relationship between party affiliation and issues voters want candidates to discuss.
