Exam 2 Review
Suggested answers
explanatory: income bracket; response: preferred alcoholic beverage
- IV and V
\(H_0\): Income bracket and preference for alcoholic beverage are independent.
\(H_A\): Income bracket and preference for alcoholic beverage are dependent.
\(E = 250 \times \frac{500}{1000} = 125\)
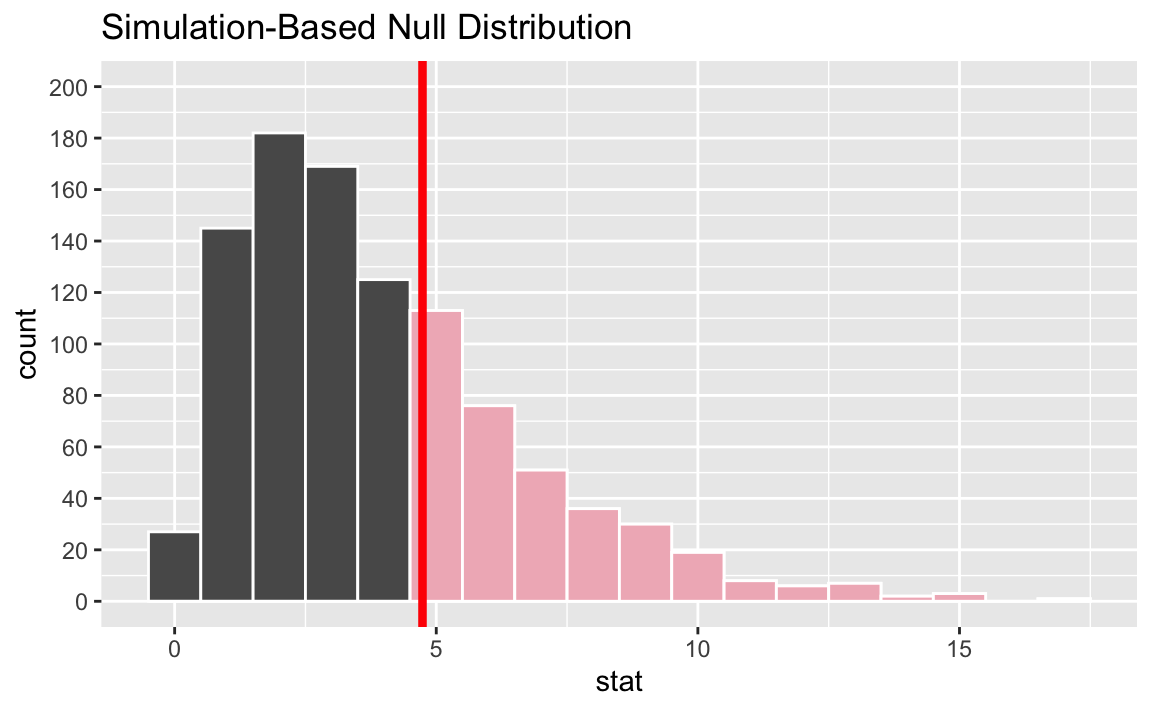
The shaded area below represents the p-value.
- Add up the heights of the bars that contain simulated sample statistics with a value of 4.74 or higher and divide by the number of simulations. Approximately 352 (113+76+51+36+30+19+8+6+7+2+3+0+1) simulations out of 1,000 meet this criteria, resulting in a p-value of approximately 0.352.
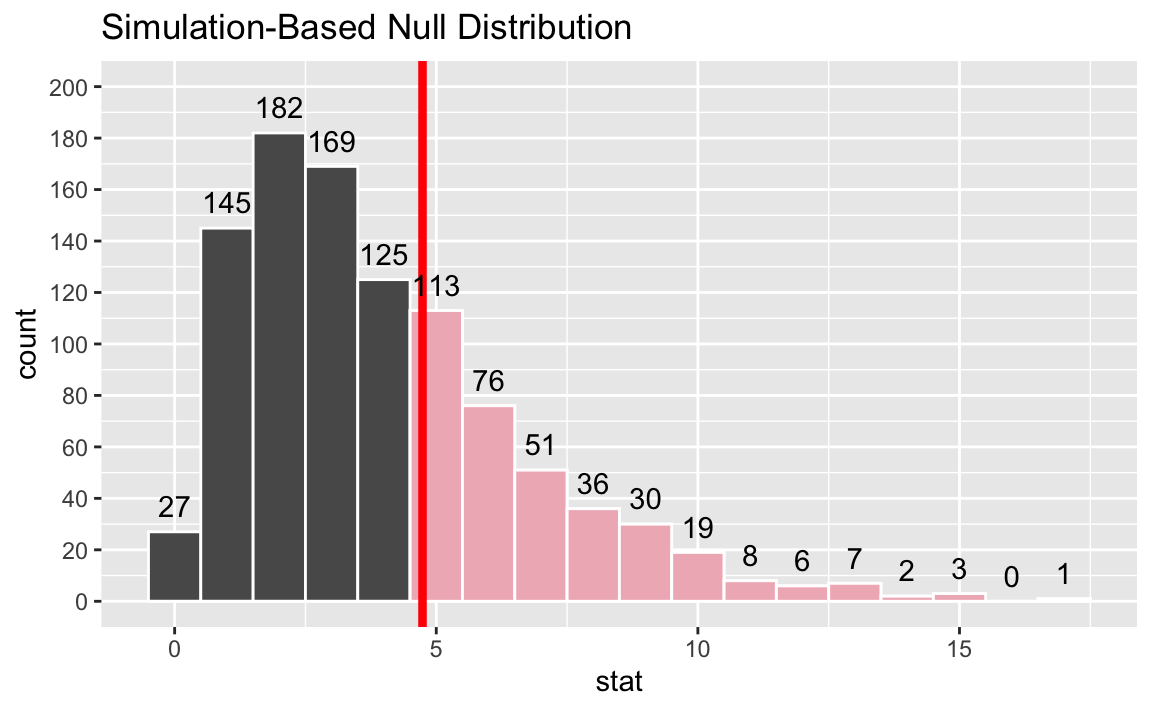
The p-value is much larger than 0.05, therefore the data do not provide convincing evidence that income bracket and preference for alcoholic beverage are dependent.
Take a random sample of size 25, with replacement, from the original sample. Calculate the proportion of students in this simulated sample who work 5 or more hours. Repeat this process 1000 times to build the bootstrap distribution. Take the middle 95% of this distribution to construct a 95% confidence interval for the true proportion of statistics majors who work 5 or more hours.
The exact 95% CI is (40%, 80%). Answers reasonably close to the upper and lower bounds would be accepted.
(e) None of the above. The correct interpretation is “We are 95% confident that 40% to 80% of statistics majors work at least 5 hours per week.”
Range of the bootstrap distribution is 0.90 - 0.30 = 0.60. This spans roughly 6 standard errors. Therefore, the approximate standard error is 0.60 / 6 = 0.10.
(c) We are 95% confident that the mean number of texts per month of all American teens is between 1450 and 1550.
(a) I > II
a. Power of the test is the probability of rejecting the null hypothesis when the null hypothesis is false.
b. Type 1 error rate is the probability of rejecting the null hypothesis when the null hypothesis is true.
c. Type 1 error rate is the probability of failing to reject the null hypothesis when the null hypothesis is false.
d. 0.05.
a. False. It will be centered at \(p\), the true population proportion.
b. False. Increasing the number of bootstrap samples does not affect the variability of the sample statistic.
c. True.